How to measure your website performance
Measuring performance using Core Web Vitals and Datadog Real User monitoring feature.
Introduction
Monitoring the performance of your website is key to having a good customer experience. If your pages are slow, you lose customers.
Approx. 50% of web users expect a load time of 3 seconds or less.
If a page takes more than 5 seconds to load, assume roughly 50% of your web traffic to leave. Your pages will increase visitors, total sessions, new users, and active users if your pages are fast.
For this post, we will discuss how to measure the performance of our own site votes.hulacorn.com using Core Web Vitals and Datadog Real User monitoring feature.
What do you measure when it comes to performance?
Core Web Vitals are the subset of Web Vitals that apply to all web pages.
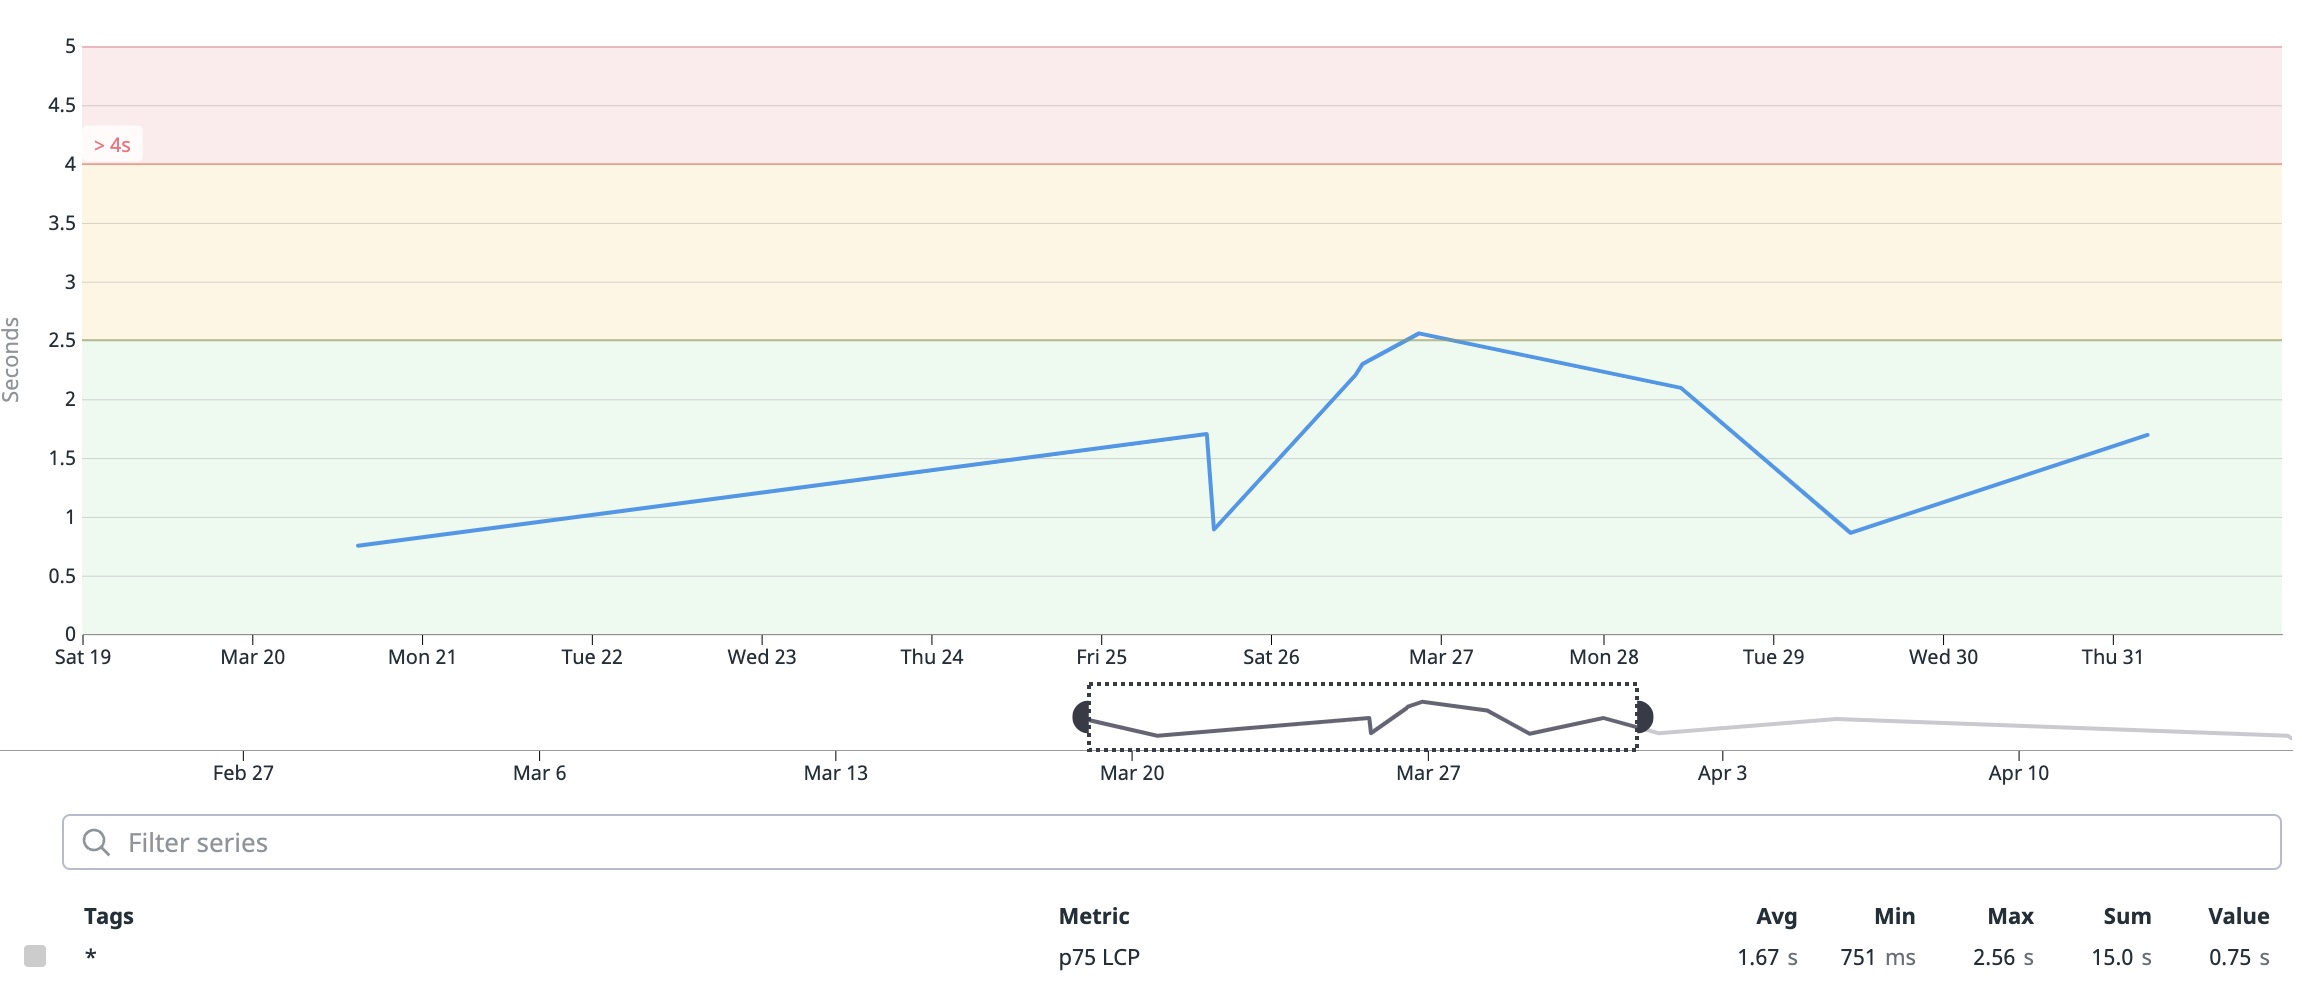
The perceived load speed using Largest Contentful Paint(LCP). The LCP metric reports the render time of the largest image or text block visible within the viewport relative to when the page first started loading. Sites should strive to have the Largest Contentful Paint of 2.5 seconds or less. On votes.hulacorn.com has a maximum of 2.56 seconds in Mar, eeek.
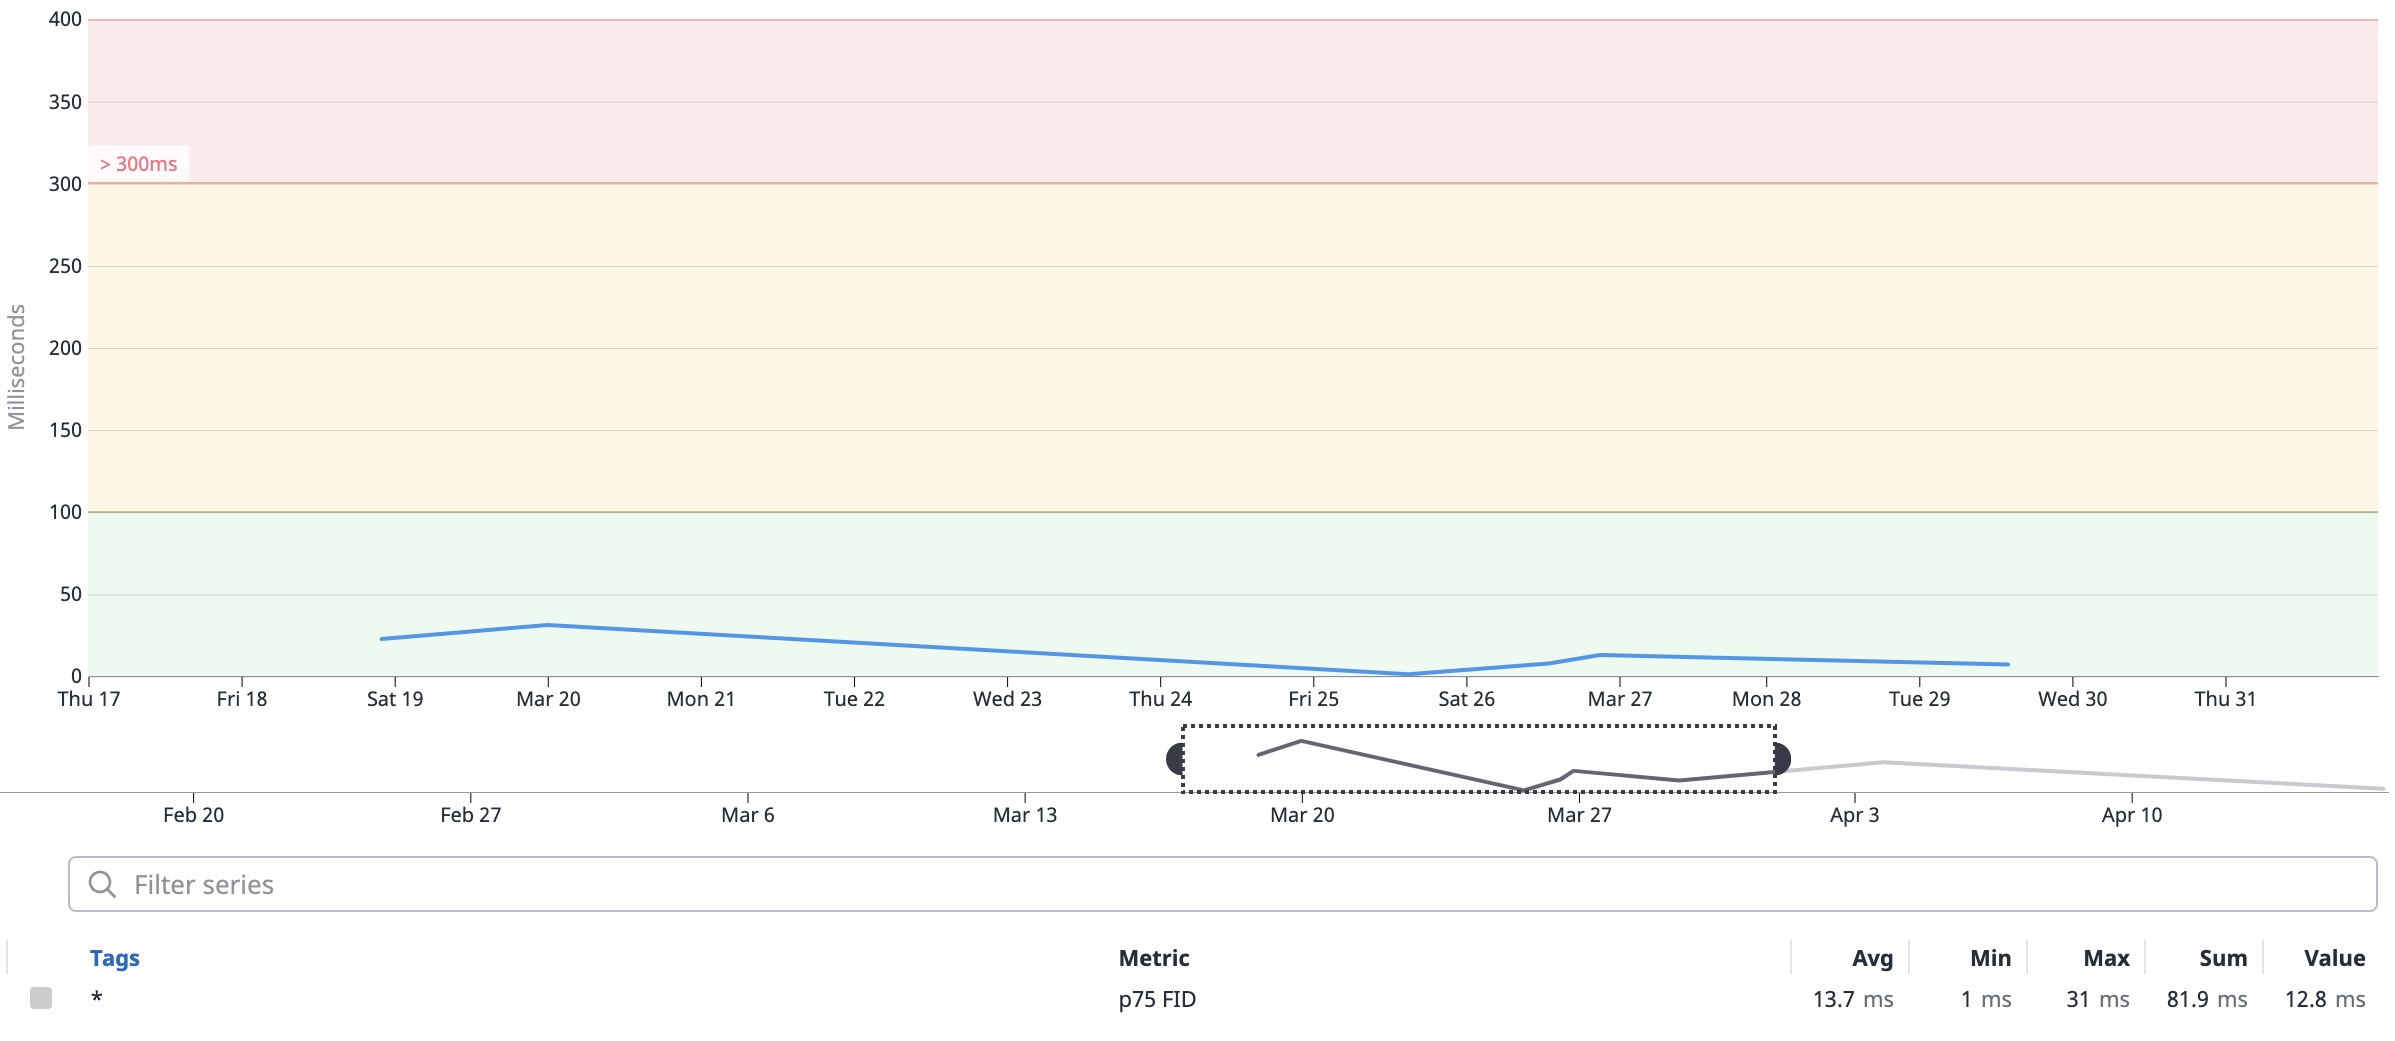
The first time the user interacts with the page to the time when the browser can begin handling that interaction. The time is called the First Input Delay(FID). We should note that the FID measures the delay in processing, not the actual processing of an event. The current best thinking for FID is less than 100 milliseconds. A common cause of a high FID is because a large JS is being loaded, and the main thread is occupied with processing this file. The FID, on votes.hulacorn.com is well below the 100 milliseconds threshold.
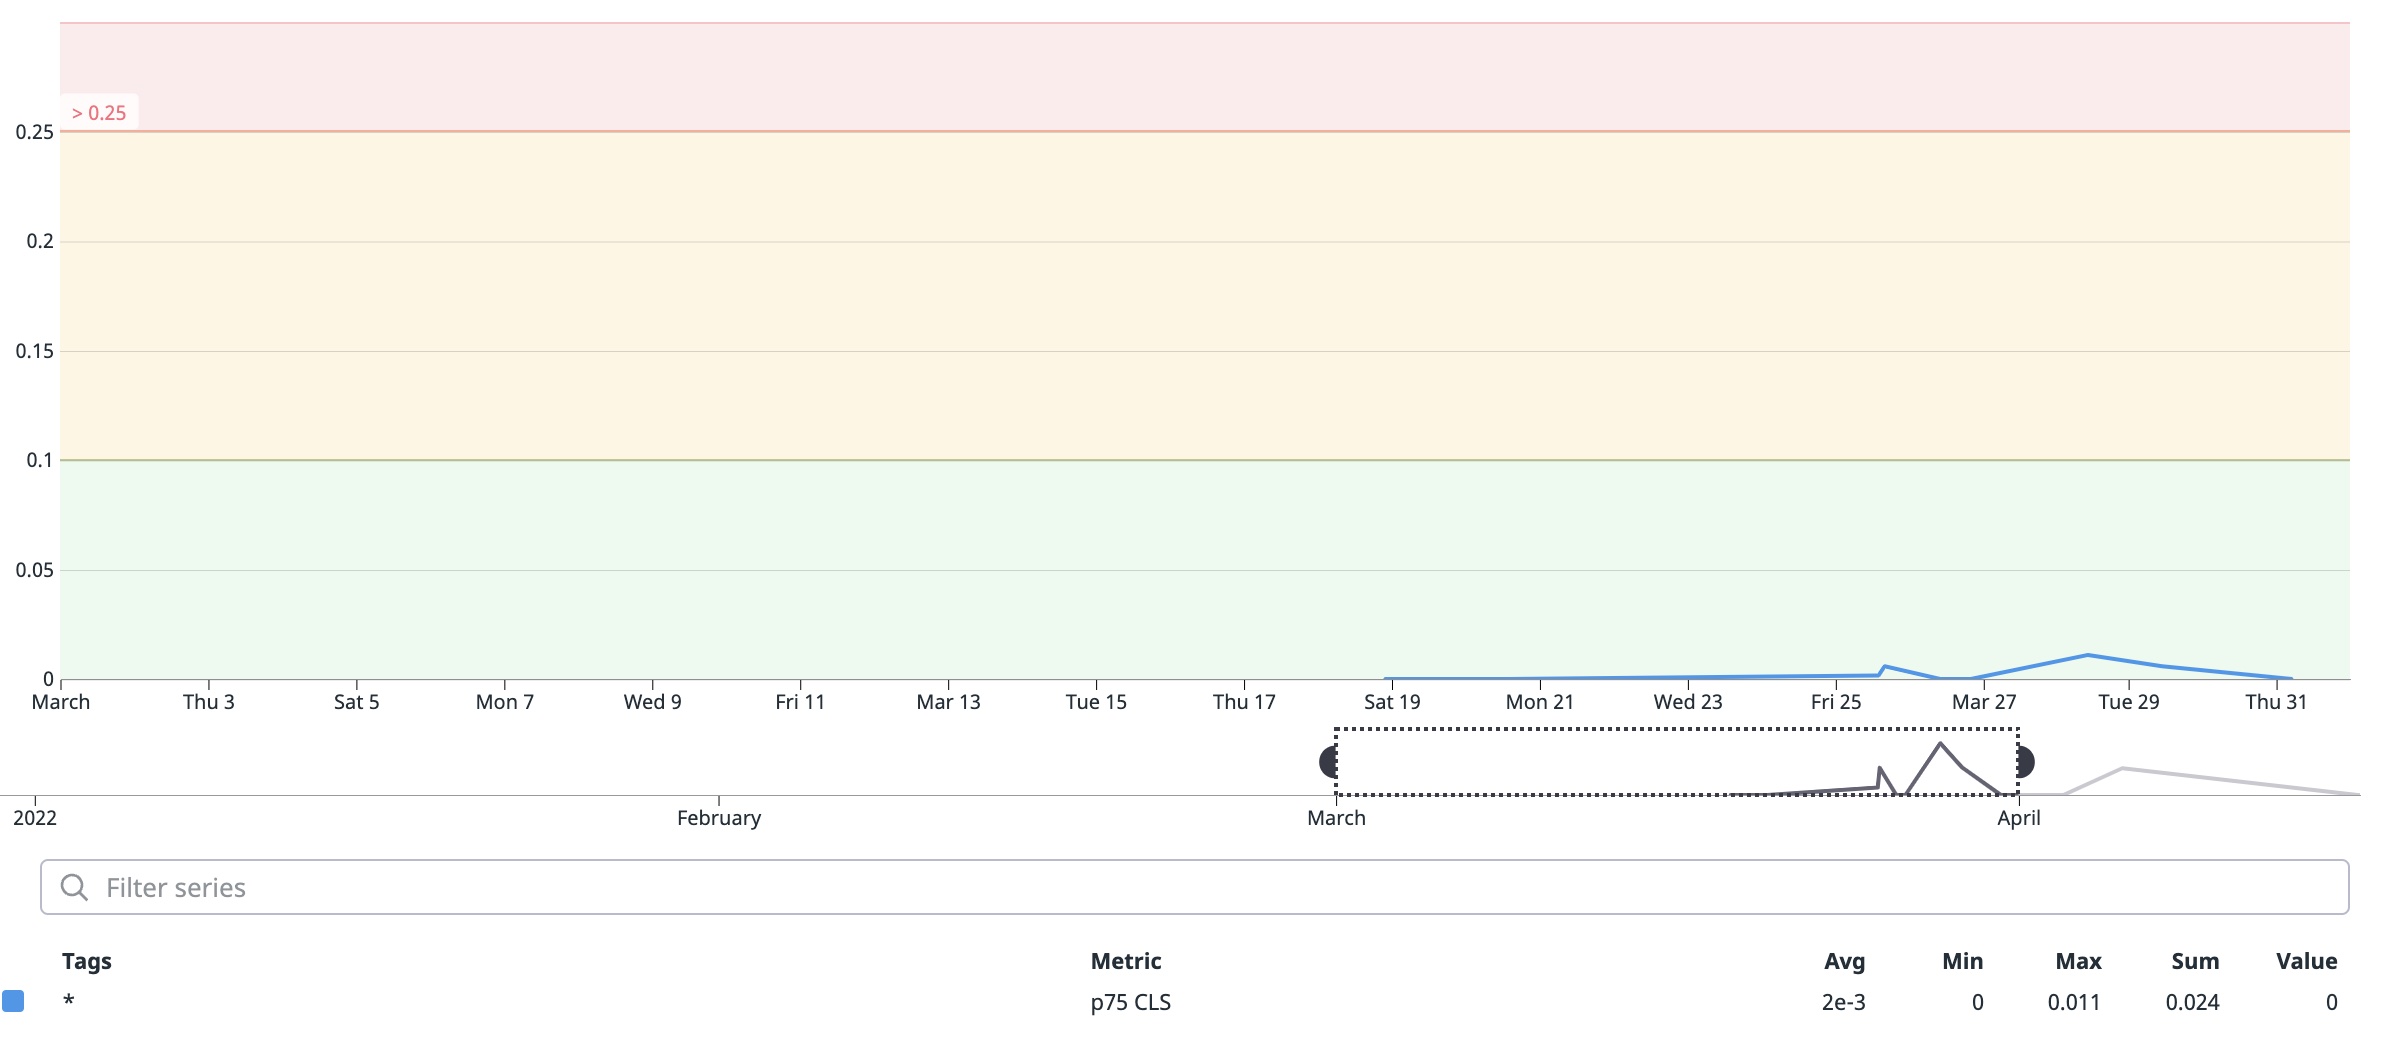
The layout changes without warning. An incredibly annoying experience. A page can be loading, and a link you want to click appears. You go to click on the link, but at the last millisecond, the layout changes, and you click on another element, possibly another link that takes you not where you want to be. The Cumulative Layout Shift (CLS) metric helps you address this problem by measuring how often it’s occurring for real users. A page should strive to have a CLS score of 0.1 or less. for votes.hulacorn.com maxes out at 0.01,
Other features in Datadog’s Real User Monitoring.
There are other features in Datadsogs RUM that we found helpful.
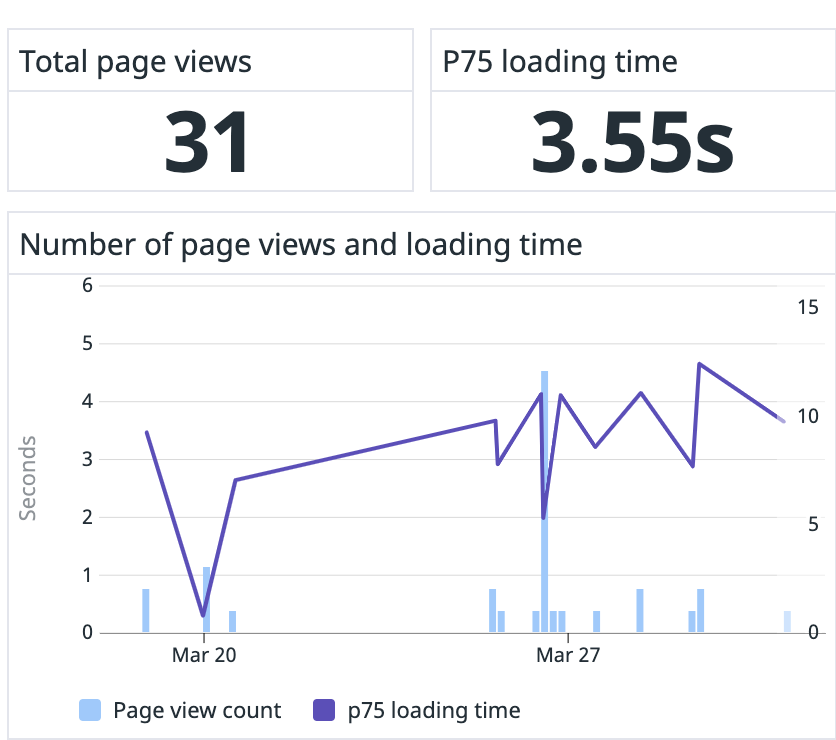
How many page views do you have? Measure how many times the pages have loaded. It shows you what pages users are visiting. Clicking on a row here provides more detail on the view, including page load speeds and resources.
Resources
What resources are loaded? How long does it take for them to load? Their size and the status code returned. The dashboard helps look at how long async requests to API take and how long the loading of javascript files takes.
A resource event is generated for images, XHR, Fetch, CSS, or JS libraries loaded on a webpage. It includes detailed loading timing information.Long tasks
A long task event is generated for any task in the browser that blocks the main thread for more than 50ms.Errors provide a list of errors experienced on the user side.
Epilogue
Using Data dog Realtime User Monitoring has helped us improve the performance of votes.hulacorn.com. Go here for more information on RUM.